Baseball players are assumed to follow a general aging curve that peaks around age 27, when his physical and mental attributes are perfectly tuned. At 27, so the thought goes, players have been in the Major Leagues or around the game long enough to grasp the intricate mental concepts of the game and instinctively know what to do on the field or at the plate. They’re old enough to have spent years stretching and strengthening, but young and spry enough to have the physical ability to actually execute the tasks that their mind begins.
I don’t intend to call this age-27 peak into question; it may very well be that 27 years is how long it takes for a baseball player’s mind and body to meet as one is on its way up and the other is on its way down. Instead, I’m going to add a wrinkle to the equation. In recent years, younger players have come to dominate the game in part because teams are promoting players more rapidly. In the case of pitchers, for instance, it may behoove a team to put a flamethrowing 20-year-old on the mound before he tears a ligament and must undergo Tommy John surgery, maximizing the benefit the team can realize before the costs of rehab time and a free-market contract can catch up to them. Do we really expect the younger players – Bryce Harper, Mike Trout, Manny Machado, and Jose Fernandez – who are today controlling the game to be significantly better at 27 than they are at 23 and 24 years old? They may grow incrementally better, but frankly, it’s hard to imagine a world in which Mike Trout is more dominant than he is today. FanGraphs recently showed that, on average, hitters really only decline.
Discuss player aging and improvement on the BSL Forums.
Instead, it may make more sense to anticipate changes in performance according to plate attempt or inning pitched. That way, a hotshot 20-year old can be compared on an experience basis to a typical 25-year old who needs to hit age 27 before he gathers the experience needed to be on top of the game. To do so, I collected a variety of stats and added up players’ experience in plate attempts and innings pitched from 2005 to 2014 so that we can take a ten-year look at how players age. Each stat is plotted against experience with a LOWESS curve overlaid. LOWESS curves are basically regression curves weighted to the points nearest it, so we can see very localized changes as a player builds experience.
One thing to note: without any information about when a player started playing or retired, some seasons by old fogies ended up with stats in the “low experience” portion of the graph even though they were really “highly experienced” players. It’s probably not enough to make a difference, but I’ll note it in the discussion of each chart below too.
Batters
Strikeout Rate

Batters seem to continuously lower their strikeout rate as they age, presumably because they gain an understanding of the Major League strike zone – and of umpires. If each umpire has a slightly personalized called strike zone, it obviously helps to have seen his zone a number of times before. If Joe West calls fastballs just outside the zone strikes more often than his peers, only an experienced batter (or a young player with a strong grasp of statistical scouting) would know to make an attempt to foul an outside fastball in a two-strike count that a strict interpretation of the zone might frown upon. There may also be a bit of favoritism in play. Umpires may be reluctant to call, say, Albert Pujols or David Ortiz out on strikes because of their venerated veterans status or their reputation for knowing the zone, whereas a free-swinging rookie without a reputation or a relationship with the umpire might not get the same benefit of the doubt.
The veterans that ended up in the “least experienced” section would presumably be bringing that side of the curve down ever so slightly, so a player might be expected to decrease his strikeout rate a little more rapidly than this curve shows as he completes his first few seasons.
On the BSL Forums, the 1,500 plate attempt threshold was discussed as the point at which players “get it.” Like the age-27 rule of thumb, this is a fine heuristic, but does it hold up when discussing strikeout rates? Not quite, as we can see above. Strikeout rates drop most significantly between 2,500 and 3,500 plate attempts for the general population of hitters.
Walk Rate

Batters also appear to get better at taking walks as they age, generally picking up one to two points of BB% from their entry into the majors to their 7,000th plate attempt. That’s a lot of experience for not a lot of payoff, really. When you consider that the veterans who were included as inexperienced players are pulling the left end of the curve up, it’s very possible that players actually improve their walk rate more rapidly than is suggested here as they gain experience.
The 1,500 plate attempt rule is supported here, with the greatest strides in taking bases on balls are made earliest in a player’s career. At 1,500 plate attempts, a batter has just about reached the midway point to his fastest gains in patience in his career.
Offense: Only the Best Batters

This plot is slightly different: it only shows batters who reached at least 3,000 plate attempts between 2005 and 2014, with the counter starting in 2005. It probably excludes any veterans on the least experienced end, but it also doesn’t include the platoon players, the bench bats, or the fourth outfielders who rarely see any opportunity to swing the lumber.
This is relevant because these are probably the strongest batters to have entered the game in the mid-2000s. It takes years to reach 3,000 plate attempts, and if a batter isn’t good enough to contribute regularly, he’ll be found out in that time. It feels like Bryce Harper has been in the game forever; he just broke 1,500 plate attempts this season.
wRC+ jumps rapidly between a player’s first cup of coffee and his 2,000th plate attempt, but levels off after that. This gives credence to the 1,500 plate attempt rule, at least among good players. A lot of early playing time helps good young hitters figure the game out and reach their potential, but they don’t continue to get improve after that point. Like the age-27 season, players hit their peak about three years (which nicely coincides with an age-23 or 24 call-up) into their careers and level off or worsen after that.
Pitchers
Strikeout Rate

Like with batters, pitchers improve as they age. They, like their offensive opponents, learn strike zones and umpires and log the innings needed to pitch effectively and earn strikes – and just plain get better at controlling pitches. An interesting wrinkle to all of this is that older pitchers are more likely to face younger batters (since everyone is younger than them), who tend to strike out more often – or is it the other way around?
Again, some veterans end up in the “inexperienced” section, helping to bump young pitchers’ strikeout rates higher. In other words, there’s probably a pretty smooth increase worth two strikeouts per nine innings on average from the time players enter the league and the time he pitches 2,000 innings.
Walk Rate

As expected, as pitchers gain more experience, they walk fewer batters per nine innings. Like with pitchers’ strikeout rates, it may be due to a combination of improving ability, knowing the strike zone, knowing umpires, and gaining a reputation.
Veterans show up in the “inexperienced” section to weight the walks per nine inning thrown by green pitchers, so there might again be a more rapid improvement of reluctance to give up free passes to batters in a pitcher’s first few big league seasons.
Pitch Selection and Location


Interestingly, veteran pitchers throw fewer fastballs, which are nice and straight and relatively easy to control. It’s why fastballs are thrown in 3-0 and 3-1 counts. With more offspeed pitches also comes more pitches outside the zone, as curveballs or changeups or sliders dart outside the zone. At the same time, batters seem not to anticipate offspeed offerings outside the zone from elder statesmen of the mound, causing the rising strikeout and decreasing walk rates realized by older pitchers.
Home Run Rate

The number of home runs given up by a pitcher decreases over time, but after a noticeable bump in a pitcher’s second full season of work, before he reaches 500 innings pitched. I personally attribute this second-year bump to the following narrative:
- when pitchers first enter the league, they’re unknown quantities. There’s no history of their pitch sequencing, command, or ability to throw heat. There’s no known tell that tips batters off as to the next pitch. As mysteries, any meatballs thrown by young pitchers go by without being taken advantage of.
-
after a season of work, there’s a book on pitchers, and they’ve never been forced to rapidly adapt. A young pitcher that enters the majors has probably dominated at most levels of play along the way; maybe he could get by with two of his three or four pitches. Once hitters know what to look for and what to expect from a pitcher who isn’t changing his strategy, they can mash his mistakes into the stands.
-
after two seasons of work, one that didn’t go as hoped, a pitcher learns a few more tricks and settles into his role on the mound. He takes his time, or even purposefully changes tempos so batters never feel comfortable in the box. He learns batters’ tendencies back, and has put enough work into his second and third pitches that he can confidently throw them for strikes while the batter chases fastballs that aren’t there.
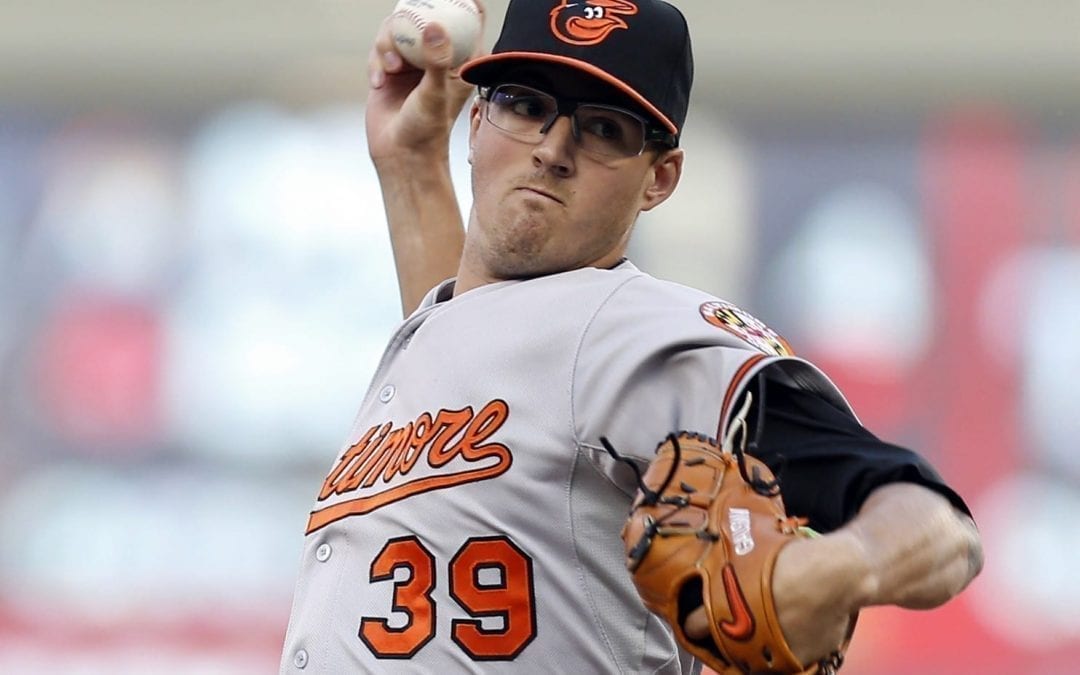
So we know that players improve with some service time, and that they improve more rapidly in the earliest years of their career, when they have the most to learn and adapt to. We know not to expect major strides from players with a history like Matt Wieters or Chris Davis, those who were counted on this season to be big players for the Orioles. At the same time, there’s hope for Kevin Gausman, who still has yet to pitch his 200th inning at the Major League level, to improve his game.

Patrick was the co-founder of Observational Studies, a blog which focused on the analysis and economics of professional sports. The native of Carroll County graduated with a Bachelor’s degree in Economics from Loyola University Maryland. Patrick works at a regional economic development and marketing firm in Baltimore, and in his free time plays lacrosse.