
The Orioles finished fourth in the AL East and will watch October from home, but Birdland still has a stake in this bracket. Three AL East rivals made the field, the Yankees and Red Sox open against each other in the Bronx, and four former Orioles are playing meaningful roles for contenders. The first pitch is tomorrow September 29th.
Adley Rutschman, traded to Boston at the deadline, is the most valuable defensive catcher on any playoff team, at +12 runs saved, and has won 41 of his 62 ABS challenges this season. In Milwaukee, DL Hall has finally stayed healthy, and his 1.91 ERA and 26.6% strikeout rate make him a real lefty weapon. Tampa Bay has two more: Cedric Mullins starts in center for his glove (+7.3 defensive runs) even though he hit just .205, and Tyler Wells has a 1.50 ERA in 18 relief innings.
The bracket
Twelve teams made the field, six per league. The top two division winners in each league get a bye to the best-of-five Division Series. The other eight play best-of-three Wild Card Series, with every game at the higher seed.
| League | Seed | Team | Record | Path |
| AL | 1 | Tampa Bay Rays | 98-64 | Bye; plays Yankees/Red Sox winner |
| AL | 2 | Cleveland Guardians | 85-77 | Bye; plays Astros/White Sox winner |
| AL | 3 | Houston Astros | 81-81 | Hosts White Sox |
| AL | 4 | New York Yankees | 93-68 | Hosts Red Sox |
| AL | 5 | Boston Red Sox | 87-75 | At Yankees |
| AL | 6 | Chicago White Sox | 84-78 | At Astros |
| NL | 1 | Milwaukee Brewers | 103-59 | Bye; plays Padres/Cubs winner |
| NL | 2 | Los Angeles Dodgers | 100-62 | Bye; plays Braves/Phillies winner |
| NL | 3 | Atlanta Braves | 94-68 | Hosts Phillies |
| NL | 4 | San Diego Padres | 91-71 | Hosts Cubs |
| NL | 5 | Chicago Cubs | 89-73 | At Padres |
| NL | 6 | Philadelphia Phillies | 88-74 | At Braves |
Yes, the 81-81 Astros host a series. Division winners are seeded ahead of wild cards, and a historically weak AL West gave Houston home field despite finishing 11½ games behind the fourth-seeded Yankees.
Wild Card Series TV schedule
All four series open Tuesday, Sept. 29th, and Game 2s are Wednesday. Any Game 3s are Thursday on NBC, Peacock or NBCSN (full matchup guide).
| Series | Games 1 & 2 (ET) | TV |
| Phillies at Braves | 2 p.m. | NBC & Peacock |
| White Sox at Astros | 5 p.m. | Peacock & NBCSN |
| Red Sox at Yankees | 8 p.m. | NBC & Peacock |
| Cubs at Padres | 10 p.m. | Peacock & NBCSN |
AL Wild Card Series
No. 5 Red Sox at No. 4 Yankees
Pick: Yankees in 3. This is the seventh postseason meeting between the rivals and a rematch of last year’s Wild Card Series, which New York won 2-1 behind Cam Schlittler’s Game 3 gem. The Yankees took the season series 7-6.
This matchup is about pitching, not slugging. These were the AL’s two best run-prevention teams, at 3.73 runs allowed per game for New York and 3.77 for Boston, while both offenses finished right around league average. The Yankees led the majors with a 3.24 team ERA. Schlittler (1.95 ERA, 239 strikeouts) is the AL Cy Young favorite, and Max Fried, Gerrit Cole and Carlos Rodón follow him. Schlittler and Fried both throw a four-seamer, sinker and cutter, which lets them change looks from one trip through the order to the next. David Bednar has settled the ninth, with Brent Headrick and Paul Blackburn setting up.
Aaron Judge is the wild card within the Wild Card. A rib stress fracture cost him June through August, and he strained his calf after just seven games back. Reports on his availability range from hopeful to doubtful. New York went 41-25 with him and 52-43 without, scoring nearly a run more per game when he played. Ben Rice (41 HR) has carried the lineup in his absence.
Boston’s season has been a roller coaster. The Red Sox started 10-17 and fired Alex Cora. Under Chad Tracy they went 77-58, including a franchise record-tying 15-game winning streak in July, and Tracy just signed a three-year deal. Then the bats went cold: Boston scored the fewest runs in the majors in September and went 12-12.
The matchup to watch is Boston’s lefties. The Red Sox have the most left-handed staff in nearly 40 years, with hitters facing a southpaw in nearly 60% of plate appearances. Ranger Suárez and rookie Payton Tolle (3.03 ERA, 2.52 since August) start, while Aroldis Chapman and deadline pickup Erik Miller (1.23 ERA, 40% strikeout rate since the trade) close games. Garrett Crochet, who hasn’t pitched since April 25, could also be a bullpen option. New York hits lefties well overall, but the matchups create lineup problems. Austin Wells has a .441 OPS against lefties this year and Ryan McMahon .509, which could push Anthony Volpe to third base, a position he first played last week. Sonny Gray, the one righty ace, gives Boston a different look in whichever game he starts.
No. 6 White Sox at No. 3 Astros
Pick: White Sox in 3 (upset). This is a rematch of the 2005 World Series, which Chicago swept, and the 2021 ALDS, which Houston won in four. The Astros took the season series 5-2.
Houston posted its worst full-season winning percentage since 2014 but still made its 10th postseason in 12 years, largely because of Yordan Alvarez. He led MLB in average, OBP and slugging (.316/.432/.601) with 42 homers, while the league as a whole hit .244/.319/.400. He is hitting .400 with four homers over his last 11 games and owns a .944 career postseason OPS. The rest of the roster is thin. Houston’s 4.45 team ERA ranked 24th, and after Hunter Brown the rotation is Peter Lambert and Hayden Wesneski. Josh Hader, Bryan Abreu and Tatsuya Imai, who has a 2.12 ERA since moving to relief, will be asked to cover a lot of innings.
The White Sox lost a record 121 games two years ago and are now the field’s feel-good story. They finished fifth in runs on the strength of three 30-homer bats: Miguel Vargas (33 HR, 100-plus walks), Munetaka Murakami (35) and Colson Montgomery (31). The worry is that Murakami (.154) and Montgomery (.158) have two of the lowest averages in the majors since Aug. 1. The rotation of Sean Burke, Davis Martin, Anthony Kay and Erick Fedde is the weakest in the field. The bullpen is not: Grant Taylor and Hagen Smith anchor it, and Jordan Hicks has struck out 39% of hitters since changing his arm slot in June. If Chicago pitches around Alvarez and its sluggers wake up, this upset is very live.
NL Wild Card Series
No. 5 Cubs at No. 4 Padres
Pick: Padres in 3. This is the closest series of the round and a rematch of last year’s Wild Card Series, which the Cubs won 2-1 at Wrigley. Chicago also went 5-1 against San Diego this season, including a 23-3 rout. That history is the best argument against this pick. Game 1 is Michael King vs. Matthew Boyd, and San Diego is a slight favorite.
The Padres are the hottest team in the field. They closed the season 17-3 and are 41-18 since July 24, the best record in baseball over that span. After ranking last in the majors in runs, average and OPS at the All-Star break, they led MLB in average after it, as Fernando Tatis Jr., Jackson Merrill and Ty France all hit like stars. First-year manager Craig Stammen, a longtime reliever himself, gets to deploy the deepest bullpen in the field. Mason Miller ranks first in the majors in expected ERA, and his slider gets a 56% whiff rate, the best of any qualifying pitch. Adrián Morejon and rookie Bradgley Rodriguez (2.38 ERA) also rank in the top 10 by expected ERA, and Yuki Matsui and a returning Jason Adam add depth.
Chicago has the best lineup and the best defense in baseball. The Cubs led MLB in runs and OPS, hit 220 homers and posted a 114 wRC+. Pete Crow-Armstrong put together one of the great seasons of the century: 45 homers, 41 steals, a 157 wRC+ and 10.6 WAR. He also ranked first in defensive value and a close second in offensive value, a combination no player has ever managed. His nine leadoff homers rank third in MLB, so watch the first pitch. As a team, the Cubs saved +68 runs in the field, the most of the Statcast era. Alex Bregman (28 HR, 5.6 WAR) is back from facial fractures, and Seiya Suzuki (26 HR) is in a contract year.
The pitching is the problem. The Cubs posted a 4.12 ERA and a 4.60 FIP, allowed 1.44 homers per nine and threw the softest fastballs in the majors. Shota Imanaga gave up 1.81 homers per nine. They’re also road-weary: rain from a nor’easter sent them from Chicago to Boston to St. Petersburg to San Diego in five days.
No. 6 Phillies at No. 3 Braves
Pick: Braves in 3. Atlanta went 9-4 against Philadelphia this season. But the Phillies have won all three previous postseason meetings, including as a wild card over division-champion Atlanta in both 2022 and 2023. The Braves haven’t won a playoff series since their 2021 title.
Chris Sale is the reason to like Atlanta. At 37 he posted a 2.16 ERA, a 2.28 FIP, a 30.9% strikeout rate and 5.8 WAR, and he has owned Philadelphia’s lefty sluggers: Bryce Harper is 2-for-21 against him and Kyle Schwarber 2-for-25. Tyler Mahle (1.28 ERA in eight starts after the deadline) is a strong No. 2, although he was hit for five runs in his final start. The bullpen is deep: Raisel Iglesias closes, Robert Suarez has a 0.82 ERA in 33 innings, and Didier Fuentes, the youngest pitcher on any big-league roster, has struck out 31.6% of hitters.
The lineup’s names are scarier than its numbers. Matt Olson (41 HR), Drake Baldwin and Michael Harris II all produced, but Austin Riley and Ozzie Albies had down years. The team posted a league-average offense by wRC+ despite topping 200 homers. Atlanta does have the NL’s highest rate of 75-plus mph swings, and Ronald Acuña Jr. hit seven homers with a 1.000-plus OPS in September.
Philadelphia’s stars are real, but the team is limping in. Zack Wheeler pitched Game 162 and won’t be on full rest at any point in this series. Jesús Luzardo (shoulder) has thrown only one relief inning since Sept. 7. Cristopher Sánchez had a 5.12 ERA in September and won’t be on full rest until Wednesday, so rookie Andrew Painter may start. The bullpen’s 5.79 ERA since Sept. 1 is the worst in MLB. On offense, only Harper and Schwarber (MLB-best 45 HR) finished above average, but they rank second and third in the majors in run value against fastballs. The Phillies are 8-4 in postseason games when Schwarber homers and 13-13 when he doesn’t.
The teams waiting on the bye
Tampa Bay Rays (AL No. 1, 98-64)
In their first year back at Tropicana Field, the Rays went 55-26 at home, the best home record in baseball, and they have home field until the World Series. They do almost nothing poorly. They struck out less than any team, hit an MLB-best .283 with runners in scoring position and led the AL in steals. Junior Caminero (42 HR, 142 wRC+, 5.3 WAR) has the fastest average bat speed in the majors, 79.6 mph, and hit the most no-doubt homers. Chandler Simpson is his mirror image: he stole 46 bases and hit .306 without a single homer or even a single barrel. Drew Rasmussen (2.67 ERA, 2.82 FIP, 5.0 WAR) leads the rotation, and closer Bryan Baker (1.44 ERA) heads a bullpen that also includes Kevin Kelly, Cam Booser and ex-Oriole Tyler Wells. The concerns: Caminero, Jonathan Aranda and Yandy Díaz hit more than half the team’s homers, Shane McClanahan’s status is uncertain, and the Rays are one of the six weakest lineups against left-handed pitching. That last one is a problem if Boston’s lefty-heavy staff advances.
Cleveland Guardians (AL No. 2, 85-77)
Cleveland won its third straight division title despite José Ramírez having the worst season of his career, and it enters as the hottest team in the AL by Bill James’ “team temperature” formula. As usual, the Guardians are built on pitching. Rookie Parker Messick (2.56 ERA, 193 strikeouts in 186⅓ innings) is a Cy Young and Rookie of the Year candidate, Gavin Williams misses bats, and closer Cade Smith saved 41 games with a 1.95 ERA. Keep an eye on Daniel Espino, who is averaging 98.8 mph out of the bullpen after years of shoulder injuries. The offense is the issue: it scored the fewest runs of any playoff team, had no 20-homer hitter and ranks among the six weakest against lefties. Cleveland went 27-22 in one-run games and will need more of those, with Steven Kwan (MLB’s leader in OBP since July) setting the table.
Milwaukee Brewers (NL No. 1, 103-59)
This is the best season in franchise history and the best record in baseball. Jacob Misiorowski was the best pitcher in the sport: 1.80 ERA, 2.17 FIP, 37.9% strikeout rate and 6.6 WAR in 174⅔ innings, with two of every three fastballs at 100 mph or harder. Logan Henderson (2.47 ERA) set a rookie record with an 0.84 WHIP among pitchers with 15-plus starts. Trevor Megill (1.85 FIP), Abner Uribe (1.97 ERA), Aaron Ashby and ex-Oriole DL Hall make up one of the two best bullpens in the field. The Brewers finished second in runs despite hitting only 154 homers, the fewest in MLB, by leading the majors in average and OBP. Brice Turang (5.9 WAR), Jackson Chourio (130 wRC+) and Jake Bauers (143 wRC+) lead that group. Two questions: who starts Games 3 and 4 after Kyle Harrison faded, and whether a low-power lineup can do more than the four runs it scored in four NLCS games against the Dodgers last year.
Los Angeles Dodgers (NL No. 2, 100-62)
The two-time defending champions are the betting favorite and are chasing the first NL three-peat. Their rotation is the deepest in the field. Yoshinobu Yamamoto posted a 2.53 ERA, deadline prize Tarik Skubal had a 2.36 FIP in 10 Dodgers starts, Blake Snell had a 1.90 ERA after returning, and Tyler Glasnow struck out 34% of hitters. Skubal’s changeup produced 27 strikeouts over his last two postseasons with Detroit, the most by any single pitch in that span. The worries are health and the back of the bullpen. The Dodgers have MLB’s oldest roster at 31.1 years. Shohei Ohtani (30 HR, 139 wRC+) is playing on a sore knee and won’t pitch again this year after posting a 1.79 ERA in 85⅔ innings. Edwin Díaz has an 8.68 ERA in 18⅔ innings, and hard-throwing reliever Edgardo Henriquez (back) may be unavailable, which leaves Tanner Scott (2.10 FIP) and Alex Vesia to close games. Kyle Tucker was a league-average hitter overall but got hot in September.
The field by the numbers
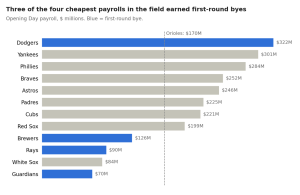
Money didn’t buy seeding this year: the two best records in the AL and NL belong to teams in the bottom half of the payroll table. Here’s how the 12 teams stack up on spending, hitting, pitching, defense and against each other.
Spending
Source: USA Today, MLB Labor Relations Department figures · 40-man Opening Day payroll in present-day value · 2026
The Dodgers opened the season spending about 4.6 times what the Guardians did. The Orioles’ $170 million payroll was bigger than those of four playoff teams, including both No. 1 seeds (full payroll list).
Offense
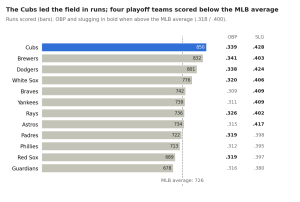
Source: Baseball-Reference team batting · 2026 regular season through Sept. 27
Only the Cubs and Dodgers beat the league average in both on-base percentage and slugging by a wide margin. Milwaukee got on base more than anyone but hit for league-average power, and Cleveland’s .380 slugging is the lowest in the field (team batting).
Pitching
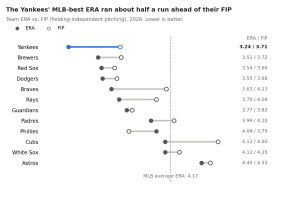
Source: Baseball-Reference team pitching (ERA, FIP) · 2026 regular season
FIP strips out defense and luck on balls in play, so a big gap between the two numbers is worth noticing. Atlanta and Chicago both allowed roughly half a run fewer per nine than their FIPs suggest, and the Cubs’ 4.60 FIP is the worst in the field. Philadelphia is the only playoff staff whose FIP (3.79) is better than its ERA (4.04), which fits a bullpen that leaked runs all September (team pitching).
Defense
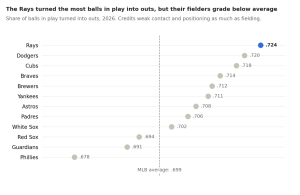
Source: Baseball-Reference team fielding (defensive efficiency) · 2026 regular season
Defensive efficiency is a blunt tool. It credits a defense for every ball in play that becomes an out, whether that took a diving stop or just a pitcher inducing a lazy fly ball, so it mixes fielding with the quality of contact a staff allows. Tampa Bay shows the gap: the Rays top this chart, but through 158 games they were tied for 21st in errors, at -4 in DRA and at -10 outs above average. Their number says more about the contact their pitchers allowed and where their fielders were positioned than about their gloves. The Cubs are the case where the two agree, since their third-place mark here comes with a defense that set a Statcast-era record for runs saved. The Phillies’ .678 is the lowest of any playoff team (team fielding).
Head-to-head
| Wild Card Series | 2026 season series | Series edge went to |
| Red Sox at Yankees | Yankees 7-6 | Home team |
| White Sox at Astros | Astros 5-2 | Home team |
| Cubs at Padres | Cubs 5-1 | Road team |
| Phillies at Braves | Braves 9-4 | Home team |
Three of the four host teams won the season series. The exception is San Diego, which went 1-5 against Chicago, including a 23-3 loss, and still gets to host because it won more games overall.
Why October is a coin flip
Everything above measures six months of baseball. The next month gets decided in bursts of three, five and seven games, and short series are bad at sorting good teams from very good ones.
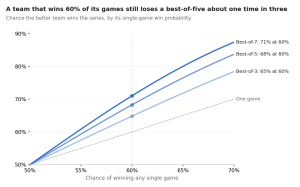
Source: Calculated from single-game win probability, treating each game as independent with the same odds
The math is humbling. Give a team a 60% chance to win every game, which is better than any club in this field managed over 162 (the Brewers won 63.6% against the whole league, not just playoff teams), and it wins a best-of-three only about 65% of the time, a best-of-five about 68% and a best-of-seven about 71%. A statistical study cited by CBS Sports found that baseball would need a best-of-75 series for the better team to advance even 80% of the time. CBS’s broader point is that the real source of October chaos is letting 12 teams in, not the bye or the layoff.
The hot-and-cold narratives don’t hold up much better. NBC Sports’ Eric Samulski checked every playoff team from 2016 to 2025 and found almost no correlation between September winning percentage and how far a team went. The 2021 Cardinals went 22-7 in September and lost the Wild Card game. The 2025 Tigers went 7-17 and won their Wild Card series. The 2023 Diamondbacks had the worst September OPS in the field and reached the World Series.
That cuts both ways for this bracket. Boston’s 12-12 September, the Phillies’ final-week meltdown and the Cubs’ road-weary finish are less damning than they look, and San Diego’s 17-3 closing kick guarantees nothing. Samulski’s advice is to trust season-long quality over a hot month, which favors teams like the Cubs, Dodgers and Brewers. It’s also why our picks lean on full-season rotations and run prevention rather than September form, and why no bracket, ours included, should be expected to survive October intact.
What this field tells us
October can’t be bought, at least not the easy way. Three of the four teams with byes carry three of the four smallest payrolls in the field: Cleveland ($70 million), Tampa Bay ($90 million) and Milwaukee ($125 million). The Dodgers are the only big spender who earned a week off. Four of the five biggest payrolls (Yankees, Phillies, Braves and Astros) have to survive a best-of-three first, and Houston spent $246 million to go 81-81.
Run prevention is what separated the bye teams. All four finished with team ERAs below the 4.17 MLB average, and Milwaukee (3.51) and Los Angeles (3.55) backed theirs up with FIPs under 3.75. Offense was a much looser filter. Four playoff teams scored fewer runs than an average club, the best record in baseball belongs to the team that hit the fewest homers, and only the Cubs and Dodgers were clearly above average at both getting on base and hitting for power.
The cheap contenders are also the young ones. The White Sox (25.8), Guardians (26.9) and Brewers (27.3) have the three youngest lineups in the field by average age (team batting), and all three cost less than $126 million. The Dodgers (30.9) and Phillies (30.1) have the two oldest and are among the four most expensive. Young, inexpensive, pitching-first rosters are how mid-market teams got in. The veteran payrolls still have the higher ceilings, but they also carry most of the health questions: Aaron Judge’s calf, Shohei Ohtani’s knee and Jesús Luzardo’s shoulder.
Finally, the gap between ERA and FIP flags which staffs may have had help. Atlanta (0.50 runs), Chicago (0.48), New York (0.47) and Tampa Bay (0.34) all allowed noticeably fewer runs than their FIPs predict, while Philadelphia is the only team that pitched better than its ERA. Over three or five games that matters less than who’s on the mound, but it’s a reason not to treat the Yankees’ MLB-best ERA as untouchable.
What we like most, and question most, about each team
| Team | What we like most | What we question most |
| Rays | Contact and pressure: the fewest strikeouts in MLB, an MLB-best .283 with runners in scoring position, the AL lead in steals and a 55-26 home record. | Power and gloves. Three hitters produced more than half the homers, and the league-best defensive efficiency hides below-average fielding (-10 outs above average). |
| Guardians | A pitching staff that’s for real: a 3.77 ERA backed by a 3.82 FIP, with Parker Messick, Gavin Williams and Cade Smith. | An offense that scored the fewest runs in the field (678) and slugged .380, also the lowest. |
| Astros | Yordan Alvarez, who led MLB in all three slash stats and owns a .944 career postseason OPS. | Everything around him. Houston’s 4.45 ERA and 4.53 FIP are the worst in the field. |
| Yankees | The rotation: an MLB-best 3.24 ERA led by Cam Schlittler and Max Fried, with Gerrit Cole and Carlos Rodón behind them. | A .311 OBP and a FIP (3.71) nearly half a run worse than the ERA, plus Judge’s uncertain status. |
| Red Sox | A staff whose numbers hold up: a 3.54 ERA and 3.66 FIP, plus a lefty-heavy pitching plan built for this matchup. | The bats. Boston scored 689 runs and the fewest in MLB in September. |
| White Sox | Power and a late-inning bullpen: 776 runs (fourth in the field), three 30-homer hitters, and Grant Taylor, Hagen Smith and Jordan Hicks. | The weakest rotation in the field and the youngest lineup, with Munetaka Murakami and Colson Montgomery slumping. |
| Brewers | The most complete team: best record, 832 runs, a field-best .341 OBP, a 3.51 ERA and above-average defense, on a $125 million payroll. | Power. Milwaukee’s 154 homers were the fewest in MLB, and it still needs Game 3 and 4 starters. |
| Dodgers | Stars on both sides: 801 runs with a .338/.424 line, and a 3.55 ERA backed by a 3.68 FIP. | The oldest roster in the field and a shaky ninth inning, with Edwin Díaz at an 8.68 ERA. |
| Braves | Chris Sale (2.16 ERA, 2.28 FIP) and a deep bullpen led by Raisel Iglesias and Robert Suarez. | A .309 OBP, lowest in the field, and the biggest gap between ERA (3.63) and FIP (4.13). |
| Padres | The deepest bullpen in the field, and a 41-18 record since July 24. | A full-season offense that scored 722 runs, below the MLB average, and a 1-5 record against the Cubs. |
| Cubs | The best lineup (850 runs, .339/.428) and a record-setting defense. | Pitching. The Cubs’ 4.60 FIP is the worst in the field, and they allowed 1.44 homers per nine. |
| Phillies | A rotation of Zack Wheeler, Cristopher Sánchez and Luzardo, and a FIP (3.79) that says the staff was better than its 4.04 ERA. | The field’s worst defensive efficiency (.678), a 5.79 bullpen ERA in September, and an offense that leans almost entirely on Bryce Harper and Kyle Schwarber. |
Depth: what money buys, and what the farm buys
Payroll doesn’t guarantee a playoff spot, but it does buy insurance. A big payroll lets a team carry proven veterans all over the roster, so an injury or a slump gets covered by a capable replacement instead of a Triple-A call-up. The Yankees are the case study. Aaron Judge played just 66 games and four of their six starting pitchers missed significant time, yet New York still posted the AL’s best run differential, +138 (Pinstripe Alley). The Dodgers, with the oldest roster in the field and a long injured list, still won 100.
There is a second way to build depth, and it runs through the farm system. A strong system supplies cheap replacements when injuries hit and trade chips when a contender needs help at the deadline. Milwaukee showed the first half of that on the final weekend alone: Andrew Vaughn went to the injured list, Cooper Pratt was scratched, and the Brewers swept anyway, and 10 different pitchers recorded a save for them this season (Brew Crew Ball).
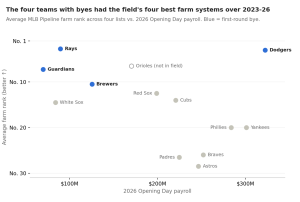
Source: MLB Pipeline farm system rankings (2023 preseason, 2024 midseason, 2025 preseason, 2026 midseason) · USA Today Opening Day payroll
| Team | 2023 preseason | 2024 midseason | 2025 preseason | 2026 midseason |
| Dodgers | 2 | 5 | 4 | 1 |
| Rays | 6 | 1 | 2 | 2 |
| Guardians | 4 | 4 | 9 | 12 |
| Brewers | 15 | 17 | 7 | 3 |
| Red Sox | 16 | 7 | 3 | 24 |
| Cubs | 12 | 8 | 8 | 28 |
| White Sox | 26 | 11 | 6 | 15 |
| Yankees | 13 | 18 | 22 | 27 |
| Phillies | 21 | 16 | 17 | 26 |
| Braves | 30 | 27 | 26 | 21 |
| Padres | 23 | 28 | 25 | 30 |
| Astros | 27 | 29 | 29 | 29 |
| Orioles (for reference) | 1 | 3 | 15 | 7 |
The pattern is hard to miss. The four teams with byes had the four best average farm rankings in the field over these four lists, and three of them did it with bottom-four payrolls. The Dodgers are the only club doing both at once. They’re back at No. 1 even after sending two Top 100 prospects to Detroit for Tarik Skubal (MLB Pipeline, 2026).
The teams that spent big and let their systems thin out are all playing this week. Houston has ranked 29th on five straight lists, which leaves little cushion when the big-league roster underperforms, and a $246 million payroll finished 81-81. San Diego is 30th after years of trading prospects at the deadline. The Cubs have traded away 15 players who now appear on other teams’ Top 30 lists, more than anyone, and fell from eighth to 28th in a year and a half. The Yankees slid from 13th to 27th while trading to reinforce the big-league club. Those trades built the bullpens and lineups these teams are bringing into October. The cost shows up in depth.
Boston shows the trade-off in real time. The Red Sox fell 10 spots in one cycle, from 14th to 24th, after graduating three rookie pitchers and sending three of their six best prospects to Baltimore for Adley Rutschman. That same deal helped push the Orioles’ system from 13th to seventh (2023 rankings, 2024, 2025).
Comparing the leagues
Since the National League adopted the DH in 2022, both leagues play the same game, and since 2023 every team has played every other team. That makes AL-vs.-NL comparisons more direct than they used to be. Three things still differ: the league each team spends most of its schedule in, the division it plays 52 games against, and its home park.
Start with the leagues. The NL won the interleague series 381-334 this season, a .533 winning percentage (StatMuse). NL teams also scored 4.61 runs per game to the AL’s 4.35, and Coors Field isn’t the reason, since the Rockies scored almost exactly a league-average number of runs (team batting). The NL was the stronger league this year.
The divisions matter even more, because 52 of every team’s 162 games come against division rivals. Here’s how each division did against everyone outside it:
| Division | Record vs. other divisions | Win % | Playoff teams |
| AL East | 306-242 | .558 | Rays, Yankees, Red Sox |
| NL Central | 296-254 | .538 | Brewers, Cubs |
| NL East | 283-267 | .515 | Braves, Phillies |
| NL West | 270-280 | .491 | Dodgers, Padres |
| AL Central | 261-289 | .475 | Guardians, White Sox |
| AL West | 233-317 | .424 | Astros |
Houston is the extreme case: its division played .424 ball against everyone else, which is how 81-81 won a title. Cleveland and the White Sox also came out of a below-.500 division. Tampa Bay’s 98 wins and the Yankees’ 93 came with a third of their schedule against the best division in baseball, and Milwaukee’s 103 came in the NL’s best.
Parks are the last piece, and they’re why raw numbers can mislead. OPS+ and ERA+ adjust for both park and league, with 100 as average.
Source: Baseball-Reference team batting (OPS+) and pitching (ERA+) · 2026 regular season
On that scale, the Yankees (99 OPS+, 130 ERA+), Dodgers (109, 120) and Brewers (105, 120) are the most complete teams, and Houston is the only one with a below-average staff. Philadelphia’s .707 OPS looks close to average until you adjust for its park and league, which drops it to an 89 OPS+, lowest in the field. One more adjustment belongs on top: because the NL was the stronger league, a 105 for an NL team probably means a bit more than a 105 for an AL team. That’s a point in favor of the Brewers and Dodgers, and a small discount for the AL Central clubs.
Adjusting for who they played
OPS+ and ERA+ handle parks and leagues, but not opponents, and no two teams play the same schedule. The Yankees never bat against their own staff, the best in baseball, but see Tampa Bay and Boston pitching 13 times each. Houston’s hitters and pitchers spent a third of their season against the weakest division in the sport. To estimate how much that matters, we weighted each team’s schedule (13 games against each division rival, about six against each other team in its league and about three against each team in the other league) and compared the runs its opponents scored and allowed with the MLB average.
| Team | Run differential per game | Schedule-adjusted | Change |
| Brewers | +1.33 | +1.29 | -0.04 |
| Dodgers | +1.24 | +1.16 | -0.08 |
| Cubs | +0.91 | +0.92 | +0.01 |
| Yankees | +0.86 | +0.83 | -0.03 |
| Braves | +0.72 | +0.71 | -0.01 |
| Rays | +0.53 | +0.52 | -0.01 |
| Red Sox | +0.48 | +0.48 | 0.00 |
| White Sox | +0.35 | +0.28 | -0.07 |
| Padres | +0.26 | +0.26 | 0.00 |
| Phillies | +0.09 | +0.14 | +0.05 |
| Guardians | +0.07 | +0.03 | -0.04 |
| Astros | -0.20 | -0.35 | -0.15 |
The effect is real but small: most teams move by less than a tenth of a run per game, and the order barely changes. The biggest adjustment belongs to Houston. Its pitchers allowed 4.73 runs per game while facing weak AL West lineups all year, and against an average schedule that figure would rise to about 4.83, so a staff that already ranked last in the field is a little worse than its raw numbers show. The two AL Central clubs slip a little too, while the Phillies, who played in a tough NL East, gain a bit. The lesson for the rest of this preview is about precision. A ranking like the Yankees’ sixth place in slugging deserves a grain of salt, since sixth and 15th are separated by just seven points of slugging, about the size of these schedule effects. Tiers are meaningful; exact ranks inside them usually aren’t. That’s also why the head-to-head records above, where two teams faced the same opponent in the same parks, are worth a look even in small samples.
Odds and our bracket
The Dodgers are the clear betting favorite, but a 10,000-simulation model sees a near dead heat between L.A. and Milwaukee.
| Team | Seed | Model WS odds | DraftKings | FanDuel |
| Dodgers | NL 2 | 21.9% | +200 | +220 |
| Brewers | NL 1 | 21.4% | +600 | +500 |
| Rays | AL 1 | 13.3% | +800 | +750 |
| Yankees | AL 4 | 10.8% | +850 | +800 |
| Guardians | AL 2 | 8.5% | +1200 | +950 |
| Red Sox | AL 5 | 4.9% | +1500 | +1600 |
| Braves | NL 3 | 4.4% | +1500 | +1500 |
| Cubs | NL 5 | 3.9% | +1700 | +1900 |
| Padres | NL 4 | 3.5% | +2000 | +2000 |
| Phillies | NL 6 | 3.1% | +2000 | +1700 |
| White Sox | AL 6 | 2.5% | +4000 | +3500 |
| Astros | AL 3 | 1.8% | +2500 | +2200 |
Both sportsbooks rate the Astros above the White Sox, the reverse of the model and of our upset pick. Odds are as of Sept. 28th, from FanDuel Sportsbook and DraftKings.
Our picks
- Wild Card: Yankees over Red Sox in 3; White Sox over Astros in 3; Padres over Cubs in 3; Braves over Phillies in 3.
- ALDS: Yankees over Rays in 5; Guardians over White Sox in 4.
- NLDS: Brewers over Padres in 5; Dodgers over Braves in 4.
- ALCS: Yankees over Guardians in 5. Four starters who can pitch deep outlast Cleveland’s thin offense.
- NLCS: Brewers over Dodgers in 7. Misiorowski and Henderson flip last year’s result, and L.A.’s shaky late innings finally cost it.
- World Series: Brewers over Yankees in 6. Milwaukee wins its first title, and Orioles fans get to watch the Yankees lose a World Series.

Owner
Chris Stoner founded Baltimore Sports and Life in 2009. He has appeared as a radio guest with 1090 WBAL, 105.7 The Fan, CBS 1300, Q1370, WOYK 1350, WKAV 1400, and WNST 1570. He has also been interviewed by The Baltimore Sun, Baltimore Business Journal, and PressBox (TV). As Owner, his responsibilities include serving as the Managing Editor, Publicist, & Sales Director.