
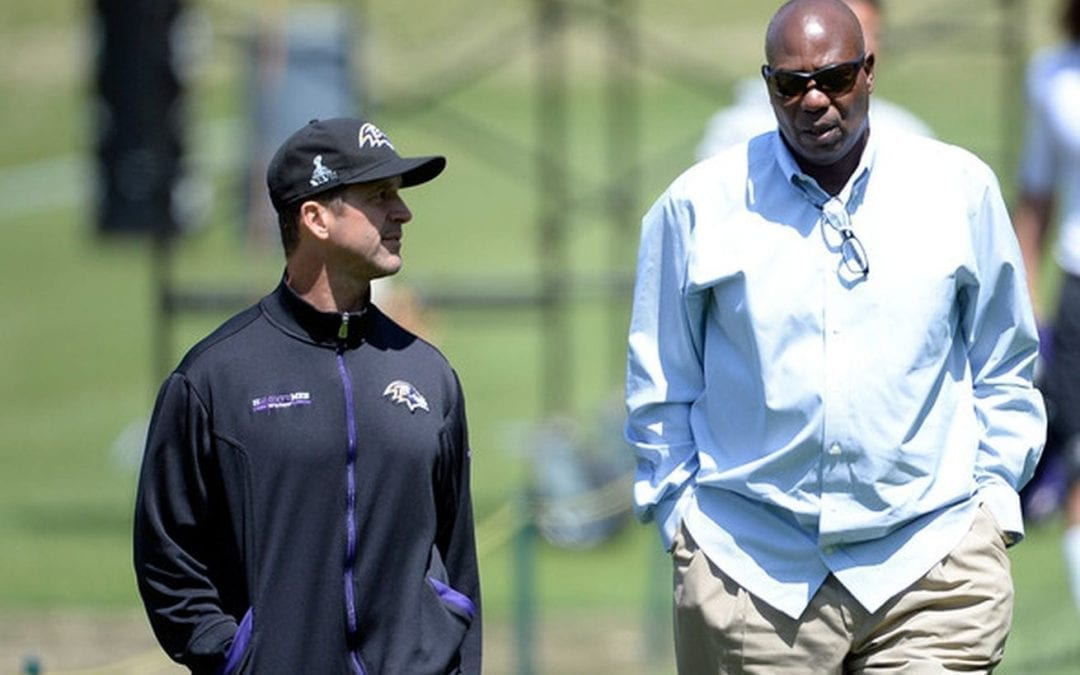
The 2015 Ravens finished 5-11. Tied with Jacksonville and San Francisco in the win column – ranked 27th and they hold the 6th pick in the first round of the April draft. The 2015 season was a disappointment for a franchise that has seen good success over the past 10 years. Beyond the win-loss record, reflective analytics give insights into the Raven’s season-long performance in several critical situations.
(You can discuss this on the BSL Board here.)
As background, every drive from the 2015 season has been analyzed using a performance metric taking into account several factors including starting field position, yardage covered and drive result. GameMaps present this information from each game is exact chronological order and has been presented in two prior posts recapping the 16 games from 2015.
How did the Ravens end up with 5 wins? The easy answer: By scoring fewer points than their opponents in 11 games last year. But more importantly, why? Areas of success and struggle can be isolated when compared to the other 31 teams in the NFL. Reference to situations or categories that correlate the strongest with winning are also made throughout the post.
Q-SCORES (Drive Performance)
Based on a season-long average of all Drive-Q values from every game, the Ravens offense ranked 22nd (-15), the defense ranked 23rd (-34) but the team ranked 27th (-26). The team is evaluated with all offensive and defensive drives and all special teams scoring plays, turnovers and missed FGs both for and against. This reveals that the special teams unit performed the poorest of all three units from the 2015 season. In comparison, the Broncos had the 4th ranked defense (+35), the 28th ranked offense (-32) and the 11th ranked team (+7). Special teams for the Broncos tipped their team Q-score up.
STARTING FIELD POSITION
Field position analysis: the ability to create a long field for your opponent and a short field for your team. The Ravens ranked 16th with a net zero field position difference. The best: NE (+7 yds), KC (+6) and SEA (+6). The worst: SD (-8) and SF(-5). This was also a category that correlated very well with winning games.
| Team | wins | Drive-Q: OFF | DEF | Team | Field Position: O Start | D Start | Ydg Diff |
|---|---|---|---|---|---|---|---|
| ARI | 13 | 73 | 34 | 58 | 72 | 73 | 0 |
| ATL | 8 | 6 | -15 | -3 | 75 | 73 | -1 |
| BAL | 5 | -15 | -34 | -26 | 73 | 73 | 0 |
| BUF | 8 | 12 | -6 | 6 | 74 | 72 | -2 |
| CAR | 15 | 57 | 51 | 55 | 69 | 73 | 4 |
| CHI | 6 | 15 | -31 | -14 | 71 | 74 | 4 |
| CIN | 12 | 57 | 34 | 42 | 70 | 75 | 5 |
| CLE | 3 | -44 | -43 | -46 | 73 | 71 | -2 |
| DAL | 4 | -30 | -41 | -39 | 76 | 73 | -3 |
| DEN | 12 | -32 | 35 | 7 | 75 | 71 | -4 |
| DET | 7 | -3 | -48 | -24 | 75 | 71 | -4 |
| GB | 10 | 1 | 14 | 9 | 72 | 74 | 2 |
| HOU | 9 | -28 | 17 | -1 | 74 | 70 | -4 |
| IND | 8 | -27 | -29 | -25 | 73 | 73 | 0 |
| JAX | 5 | 0 | -48 | -25 | 73 | 72 | -1 |
| KC | 11 | 54 | 48 | 51 | 69 | 75 | 6 |
| MIA | 6 | -31 | -32 | -28 | 74 | 73 | -2 |
| MIN | 11 | 37 | 11 | 29 | 70 | 75 | 5 |
| NE | 12 | 75 | 24 | 43 | 70 | 76 | 7 |
| NO | 7 | 40 | -63 | -11 | 74 | 73 | -1 |
| NYG | 6 | 20 | -37 | -4 | 72 | 74 | 2 |
| NYJ | 10 | 15 | 46 | 23 | 71 | 73 | 2 |
| OAK | 7 | -9 | -8 | -13 | 71 | 73 | 2 |
| PHI | 7 | -23 | -17 | -14 | 74 | 73 | -1 |
| PIT | 10 | 41 | 24 | 37 | 72 | 71 | 0 |
| SD | 4 | 1 | -42 | -24 | 77 | 69 | -8 |
| SEA | 10 | 65 | 28 | 46 | 71 | 76 | 6 |
| SF | 5 | -33 | -58 | -45 | 76 | 71 | -5 |
| STL | 7 | -38 | 21 | -11 | 73 | 74 | 1 |
| TB | 6 | 20 | -53 | -21 | 74 | 69 | -4 |
| TEN | 3 | -44 | -17 | -31 | 73 | 71 | -2 |
| WSH | 9 | 16 | -16 | 0 | 73 | 73 | 0 |
NON-SCORING DRIVES
Q-Scores are created from drive performance on all drives: scoring drives and non-scoring drives. In terms of all non-scoring drives, the Ravens ranked 28th. The top four teams in this category were KC, ARI, CAR and NE. Of the 54 categories analyzed, the non-scoring drives correlated third strongest to winning after TD differential and Team Q-Scores. What a team does with the football when they are not scoring points is extremely important as it relates to field position. I’ll take this all the way to the play-by-play level. As a position coach in college we always analyzed plays as if everyone on the field has a coin bag. On every play, either you take someone’s coin or someone is taking yours. There is no push in this regard. You are constantly sparing with your combatant on defense. Each individual battle combines for play success. Play success to drive success. Drive success to scoreboard success. What happens on non-scoring drives (NSDs) is vital because over 70% of the drives in a game result in no points.
| Team | wins | NSDs: OFF | DEF | TEAM | O # | D # |
|---|---|---|---|---|---|---|
| ARI | 13 | -160 | 199 | 42 | 90 | 120 |
| ATL | 8 | -181 | 160 | -8 | 101 | 103 |
| BAL | 5 | -174 | 146 | -25 | 119 | 104 |
| BUF | 8 | -168 | 177 | 6 | 111 | 110 |
| CAR | 15 | -163 | 185 | 36 | 99 | 131 |
| CHI | 6 | -157 | 159 | 0 | 104 | 99 |
| CIN | 12 | -156 | 181 | 31 | 95 | 119 |
| CLE | 3 | -206 | 185 | -33 | 113 | 94 |
| DAL | 4 | -185 | 141 | -31 | 110 | 96 |
| DEN | 12 | -193 | 173 | -3 | 127 | 132 |
| DET | 7 | -183 | 154 | -24 | 110 | 98 |
| GB | 10 | -180 | 173 | 4 | 111 | 118 |
| HOU | 9 | -179 | 152 | -6 | 131 | 132 |
| IND | 8 | -185 | 154 | -18 | 120 | 115 |
| JAX | 5 | -177 | 157 | -18 | 118 | 103 |
| KC | 11 | -139 | 199 | 43 | 98 | 123 |
| MIA | 6 | -176 | 149 | -26 | 128 | 109 |
| MIN | 11 | -154 | 182 | 22 | 93 | 106 |
| NE | 12 | -148 | 178 | 33 | 93 | 123 |
| NO | 7 | -154 | 163 | -5 | 100 | 91 |
| NYG | 6 | -168 | 177 | 3 | 105 | 100 |
| NYJ | 10 | -172 | 198 | 20 | 116 | 124 |
| OAK | 7 | -185 | 193 | -5 | 118 | 109 |
| PHI | 7 | -181 | 177 | -9 | 132 | 118 |
| PIT | 10 | -177 | 200 | 29 | 98 | 117 |
| SD | 4 | -171 | 153 | -20 | 112 | 96 |
| SEA | 10 | -153 | 170 | 26 | 88 | 115 |
| SF | 5 | -166 | 120 | -36 | 122 | 100 |
| STL | 7 | -153 | 185 | 4 | 135 | 121 |
| TB | 6 | -147 | 165 | -8 | 100 | 91 |
| TEN | 3 | -192 | 180 | -23 | 129 | 100 |
| WSH | 9 | -181 | 183 | 3 | 100 | 109 |
TOUCHDOWNS
In terms of TD differential, the 2015 Ravens were at negative-12 which means opponents scored 12 more TDs than the Ravens. This ranked 27th in the NFL last season.
Another revealing situation is the response to touchdowns. When the opponent scores a TD, how does the offense respond? Using Drive-Q scores, the Ravens offense ranked 17th in the NFL. How did the Ravens defense respond to a Ravens touchdown? Drive-Qs show that the defense ranked 26th in the NFL in this category. The Ravens defensive response to both team adversity and team success is an area that must improve in 2016.
The best counter-punchers on offense? Steelers and it is not even close – they were the best offense responding to a TD scored against their team. The best defenses to reinforce their team’s scoring of a touchdown: NYJ, STL and DEN. Those defenses were the strongest in the league after a TD had been scored by their offense.
| Team | wins | TDs: OFF | ALL | DEF | ALL | TD DIFF | TD Response (Q-Scores): OFF | DEF | TEAM |
|---|---|---|---|---|---|---|---|---|---|
| ARI | 13 | 51 | 58 | 33 | 34 | 24 | -27 | 55 | 25 |
| ATL | 8 | 35 | 38 | 39 | 41 | -3 | 19 | 2 | 25 |
| BAL | 5 | 29 | 33 | 40 | 45 | -12 | -15 | -40 | -18 |
| BUF | 8 | 42 | 45 | 40 | 42 | 3 | -48 | 28 | -5 |
| CAR | 15 | 55 | 59 | 32 | 35 | 24 | 25 | 5 | 7 |
| CHI | 6 | 34 | 34 | 40 | 47 | -13 | 19 | -75 | -22 |
| CIN | 12 | 49 | 50 | 26 | 29 | 21 | -35 | 53 | 23 |
| CLE | 3 | 25 | 28 | 45 | 49 | -21 | -27 | 37 | -17 |
| DAL | 4 | 24 | 26 | 35 | 41 | -15 | -55 | -96 | -85 |
| DEN | 12 | 32 | 38 | 29 | 32 | 6 | 22 | 87 | 55 |
| DET | 7 | 40 | 42 | 46 | 47 | -5 | -2 | -96 | -43 |
| GB | 10 | 40 | 42 | 33 | 35 | 7 | 4 | 53 | 30 |
| HOU | 9 | 36 | 39 | 34 | 37 | 2 | -25 | 1 | -11 |
| IND | 8 | 32 | 37 | 43 | 47 | -10 | -23 | -21 | -29 |
| JAX | 5 | 40 | 44 | 44 | 51 | -7 | -8 | -43 | -23 |
| KC | 11 | 39 | 45 | 32 | 34 | 11 | 43 | 32 | 36 |
| MIA | 6 | 35 | 39 | 44 | 46 | -7 | -81 | 8 | -43 |
| MIN | 11 | 32 | 37 | 31 | 31 | 6 | -17 | 12 | 20 |
| NE | 12 | 50 | 52 | 32 | 36 | 16 | -2 | 28 | 18 |
| NO | 7 | 48 | 51 | 57 | 59 | -8 | 20 | -61 | -13 |
| NYG | 6 | 41 | 47 | 46 | 50 | -3 | 54 | 16 | 41 |
| NYJ | 10 | 44 | 44 | 29 | 34 | 10 | -20 | 94 | 43 |
| OAK | 7 | 41 | 42 | 37 | 41 | 1 | -35 | 22 | -25 |
| PHI | 7 | 38 | 45 | 46 | 50 | -5 | -44 | -10 | -27 |
| PIT | 10 | 42 | 45 | 35 | 35 | 10 | 105 | 42 | 83 |
| SD | 4 | 34 | 35 | 39 | 44 | -9 | -13 | -36 | -23 |
| SEA | 10 | 44 | 49 | 24 | 27 | 22 | 46 | 29 | 27 |
| SF | 5 | 23 | 24 | 41 | 43 | -19 | -51 | -40 | -47 |
| STL | 7 | 27 | 30 | 28 | 32 | -2 | -93 | 91 | -1 |
| TB | 6 | 34 | 37 | 44 | 47 | -10 | -31 | 30 | -11 |
| TEN | 3 | 35 | 37 | 45 | 51 | -14 | 1 | -60 | -22 |
| WSH | 9 | 39 | 44 | 41 | 44 | 0 | -28 | 66 | 28 |
TURNOVERS
We all know the anecdotes relating to the importance of turnovers. For the season, the Ravens were at minus 15, ranking 31st. Turnover differential has a very strong correlation with win/loss record. It is slightly more important for your team to have the ability to take the ball away than not give it away. The offense had way too many turnovers last season (26) with two additional turnovers by the ST unit. In conjunction with the defense taking it way only 12 times (ranked 31st) this is an area that must improve if the team’s record is to improve next season.
Not just tracking the number of turnovers but looking at the performance on the drive following a turnover is very revealing for the Ravens. The Ravens offense ranked 5th in the NFL in terms of performance after the Ravens took the ball away from their opponent. The offense capitalized off a turnover either by scoring or successfully moving the football. However the Ravens ranked dead last in the NFL for defensive performance on the drives immediately following a turnover by the offense. The inability of the Ravens defense to respond to a sudden change situation must be improved upon in 2016. Perhaps the addition of leadership by Weddle will help in this regard.
| Team | wins | Turn- overs: OFF | Total Give- away | DEF | Total Take- away | Diff | Q-Scores AFTER Turnovers: OFF | DEF | TEAM |
|---|---|---|---|---|---|---|---|---|---|
| ARI | 13 | 22 | 24 | 31 | 33 | 9 | 200 | -39 | 122 |
| ATL | 8 | 30 | 30 | 23 | 23 | -7 | 93 | -63 | 22 |
| BAL | 5 | 26 | 28 | 12 | 13 | -15 | 169 | -238 | -113 |
| BUF | 8 | 16 | 19 | 22 | 26 | 7 | 49 | -118 | -6 |
| CAR | 15 | 19 | 19 | 38 | 39 | 20 | 167 | 19 | 133 |
| CHI | 6 | 20 | 21 | 14 | 17 | -4 | 62 | -116 | -75 |
| CIN | 12 | 17 | 17 | 27 | 28 | 11 | 81 | -91 | -6 |
| CLE | 3 | 27 | 30 | 21 | 21 | -9 | -72 | 1 | -35 |
| DAL | 4 | 31 | 33 | 10 | 11 | -22 | 47 | 51 | -9 |
| DEN | 12 | 30 | 31 | 24 | 26 | -5 | -22 | -114 | -47 |
| DET | 7 | 22 | 24 | 17 | 18 | -6 | 53 | -122 | -40 |
| GB | 10 | 17 | 17 | 21 | 22 | 5 | -79 | -47 | -59 |
| HOU | 9 | 20 | 20 | 22 | 25 | 5 | 7 | -198 | -69 |
| IND | 8 | 28 | 30 | 24 | 25 | -5 | -66 | -135 | -55 |
| JAX | 5 | 27 | 28 | 17 | 18 | -10 | 234 | -148 | -27 |
| KC | 11 | 13 | 15 | 28 | 29 | 14 | 143 | 13 | 124 |
| MIA | 6 | 20 | 21 | 16 | 16 | -5 | -7 | -168 | -84 |
| MIN | 11 | 16 | 17 | 21 | 22 | 5 | 42 | -68 | 19 |
| NE | 12 | 11 | 14 | 20 | 21 | 7 | 140 | -23 | 64 |
| NO | 7 | 19 | 20 | 21 | 22 | 2 | 59 | -72 | -19 |
| NYG | 6 | 21 | 21 | 27 | 28 | 7 | 139 | 10 | 82 |
| NYJ | 10 | 23 | 24 | 28 | 30 | 6 | 108 | -6 | 48 |
| OAK | 7 | 20 | 23 | 22 | 24 | 1 | 95 | -120 | -46 |
| PHI | 7 | 31 | 31 | 25 | 27 | -4 | 124 | -16 | 65 |
| PIT | 10 | 25 | 26 | 27 | 30 | 4 | 108 | -30 | 69 |
| SD | 4 | 22 | 24 | 18 | 20 | -4 | 40 | -42 | -34 |
| SEA | 10 | 15 | 16 | 23 | 23 | 7 | 245 | 22 | 164 |
| SF | 5 | 15 | 17 | 12 | 12 | -5 | -15 | -172 | -119 |
| STL | 7 | 20 | 21 | 24 | 26 | 5 | 79 | 68 | 54 |
| TB | 6 | 26 | 28 | 23 | 23 | -5 | 143 | -215 | -72 |
| TEN | 3 | 31 | 33 | 15 | 19 | -14 | 48 | -104 | -66 |
| WSH | 9 | 20 | 22 | 27 | 27 | 5 | -38 | -218 | -113 |
EXTREME ENDS OF THE FIELD
Let’s look at performance when drives start in the extreme ends of the field. This analysis must take into account performance but also the number of occurrences. Two categories: when drives start more than 87 yards from the end zone (long field) and when drives start less than 55 yards from the end zone (short field). These yard lines will define the extreme ends of the field. The Ravens defense ranked 12th when the opponent has a long field but ranked 25th in terms of number of occurrences (D#). On the other side of the ball, the offense ranked 20th when inheriting a long field and were ranked 4th in number of occurrences (O#). For a short field, again the defense did NOT respond well to this adversity situation and ranked 29th. The offense was ranked 15th when inheriting a short field.
| Team | wins | Short Field: OFF | DEF | TEAM | O # | D # | DIFF | Long Field: OFF | DEF | TEAM | O # | D # | DIFF | |
|---|---|---|---|---|---|---|---|---|---|---|---|---|---|---|
| ARI | 13 | 258 | -193 | 57 | 25 | 20 | 5 | 0 | 126 | 73 | 18 | 25 | 7 | |
| ATL | 8 | 29 | -66 | -21 | 17 | 19 | -2 | 39 | -21 | 9 | 20 | 21 | 1 | |
| BAL | 5 | 127 | -205 | -67 | 17 | 24 | -7 | -73 | 93 | 12 | 16 | 17 | 1 | |
| BUF | 8 | 190 | -52 | 60 | 19 | 22 | -3 | -87 | 97 | 1 | 24 | 22 | -2 | |
| CAR | 15 | 187 | 51 | 139 | 35 | 19 | 16 | -8 | 24 | 7 | 17 | 15 | -2 | |
| CHI | 6 | -9 | -236 | -91 | 30 | 17 | 13 | -12 | -9 | -10 | 22 | 19 | -3 | |
| CIN | 12 | 225 | -3 | 149 | 28 | 14 | 14 | -50 | 89 | 24 | 20 | 23 | 3 | |
| CLE | 3 | -95 | -79 | -86 | 19 | 26 | -7 | -203 | -104 | -151 | 20 | 22 | 2 | |
| DAL | 4 | 32 | -164 | -93 | 12 | 21 | -9 | 17 | 38 | 27 | 20 | 19 | -1 | |
| DEN | 12 | 6 | -93 | -52 | 20 | 28 | -8 | -151 | 106 | -52 | 29 | 18 | -11 | |
| DET | 7 | 158 | -203 | -69 | 17 | 29 | -12 | -188 | 49 | -104 | 24 | 13 | -11 | |
| GB | 10 | 80 | -26 | 34 | 26 | 20 | 6 | -133 | 122 | -9 | 20 | 19 | -1 | |
| HOU | 9 | 4 | -126 | -80 | 19 | 34 | -15 | -81 | 59 | -23 | 26 | 18 | -8 | |
| IND | 8 | -51 | -297 | -171 | 21 | 20 | 1 | -56 | 48 | 3 | 21 | 27 | 6 | |
| JAX | 5 | 306 | -200 | 16 | 18 | 24 | -6 | -152 | -142 | -147 | 19 | 17 | -2 | |
| KC | 11 | 126 | -30 | 71 | 33 | 18 | 15 | 31 | 183 | 122 | 20 | 30 | 10 | |
| MIA | 6 | 92 | -142 | -19 | 20 | 18 | 2 | -124 | -26 | -84 | 26 | 18 | -8 | |
| MIN | 11 | 181 | -22 | 114 | 31 | 15 | 16 | -27 | 34 | 3 | 17 | 16 | -1 | |
| NE | 12 | 238 | 35 | 172 | 25 | 12 | 13 | 9 | 62 | 39 | 15 | 20 | 5 | |
| NO | 7 | 126 | -150 | -4 | 18 | 16 | 2 | 29 | -36 | -4 | 18 | 19 | 1 | |
| NYG | 6 | 150 | -151 | -1 | 19 | 19 | 0 | -74 | 18 | -21 | 18 | 25 | 7 | |
| NYJ | 10 | 81 | -47 | 21 | 25 | 22 | 3 | -45 | 138 | 56 | 20 | 25 | 5 | |
| OAK | 7 | 6 | -73 | -33 | 30 | 30 | 0 | 23 | 132 | 92 | 19 | 32 | 13 | |
| PHI | 7 | 136 | -116 | -6 | 17 | 22 | -5 | -121 | 11 | -55 | 25 | 25 | 0 | |
| PIT | 10 | 129 | -16 | 55 | 26 | 27 | -1 | -11 | 190 | 90 | 24 | 24 | 0 | |
| SD | 4 | 185 | -47 | 14 | 11 | 31 | -20 | -123 | -45 | -101 | 28 | 11 | -17 | |
| SEA | 10 | 151 | -192 | 26 | 26 | 15 | 11 | 107 | 129 | 120 | 18 | 26 | 8 | |
| SF | 5 | -59 | -181 | -137 | 12 | 21 | -9 | -47 | 4 | -30 | 27 | 14 | -13 | |
| STL | 7 | 115 | 93 | 103 | 19 | 24 | -5 | -107 | 43 | -19 | 21 | 30 | 9 | |
| TB | 6 | 139 | -168 | -44 | 19 | 28 | -9 | -21 | 97 | 31 | 14 | 11 | -3 | |
| TEN | 3 | 39 | -156 | -68 | 19 | 23 | -4 | -58 | 80 | 12 | 24 | 25 | 1 | |
| WSH | 9 | 125 | -298 | -58 | 21 | 16 | 5 | -3 | 56 | 29 | 19 | 23 | 4 |
1st QUARTER and 3rd QUARTER
Finally, lets look at the 1st quarter and the 3rd quarter performance. Starting quickly is very important in terms of winning and losing. The 1st quarter performance correlates stronger with winning than the 3rd quarter performance. Best offenses in the 1st quarter – Saints, Patriots and KC. Best defenses: NYJ, MIN and DEN. The Ravens rank 19th on offense and 24th on defense in the 1st quarter. In terms of coming out of halftime, the offense ranked 30th and the defense 20th for the Ravens. The offense has this area to improve in 2016.
| Team | wins | 1st QTR: OFF | ALL | DEF | ALL | Team | 3rd Qtr: OFF | ALL | DEF | ALL | Team |
|---|---|---|---|---|---|---|---|---|---|---|---|
| ARI | 13 | 69 | 80 | -9 | 4 | 46 | 76 | 93 | 85 | 85 | 88 |
| ATL | 8 | 15 | 12 | -42 | -52 | -21 | 17 | 11 | -113 | -106 | -41 |
| BAL | 5 | 14 | 18 | -44 | -50 | -17 | -61 | -50 | -42 | -58 | -54 |
| BUF | 8 | 14 | 14 | -17 | -14 | 0 | 63 | 26 | -71 | -67 | -20 |
| CAR | 15 | 49 | 64 | -2 | -21 | 22 | 66 | 74 | 32 | 35 | 54 |
| CHI | 6 | 2 | -12 | -34 | -76 | -44 | 49 | 38 | -45 | -39 | 2 |
| CIN | 12 | 74 | 74 | 3 | 18 | 45 | 27 | 34 | 34 | 15 | 24 |
| CLE | 3 | -29 | -32 | 26 | 1 | -15 | -65 | -53 | -166 | -159 | -103 |
| DAL | 4 | -27 | -18 | 12 | 0 | -9 | -53 | -40 | -48 | -60 | -49 |
| DEN | 12 | -9 | 2 | 34 | 38 | 20 | -70 | -61 | 51 | 41 | -11 |
| DET | 7 | 30 | 30 | -18 | -14 | 7 | -44 | -54 | -56 | -45 | -49 |
| GB | 10 | 25 | 46 | 15 | 15 | 30 | 38 | 38 | -47 | -58 | -10 |
| HOU | 9 | -26 | -15 | -90 | -77 | -46 | 36 | 36 | 56 | 67 | 52 |
| IND | 8 | -11 | -13 | 0 | 13 | 0 | -34 | -23 | -99 | -98 | -62 |
| JAX | 5 | 13 | 13 | -114 | -108 | -46 | 65 | 71 | -20 | -41 | 13 |
| KC | 11 | 93 | 98 | 21 | 23 | 59 | -3 | 3 | 38 | 38 | 19 |
| MIA | 6 | -54 | -54 | -56 | -62 | -58 | -29 | -20 | -35 | -25 | -23 |
| MIN | 11 | 35 | 42 | 53 | 64 | 53 | 85 | 95 | 19 | 22 | 56 |
| NE | 12 | 117 | 117 | 17 | 19 | 65 | 71 | 64 | 20 | 10 | 39 |
| NO | 7 | 126 | 124 | -41 | -41 | 45 | 25 | 36 | -109 | -104 | -34 |
| NYG | 6 | 52 | 52 | -27 | -24 | 12 | -11 | -3 | -14 | -21 | -12 |
| NYJ | 10 | 49 | 46 | 85 | 86 | 65 | 69 | 69 | 54 | 43 | 56 |
| OAK | 7 | 16 | 12 | -96 | -105 | -47 | -3 | -13 | 20 | 22 | 4 |
| PHI | 7 | -23 | -25 | -62 | -51 | -38 | -9 | 20 | -14 | -32 | -6 |
| PIT | 10 | 47 | 32 | -45 | -45 | -4 | 51 | 63 | 80 | 81 | 73 |
| SD | 4 | -4 | -19 | -34 | -30 | -25 | -34 | -36 | 9 | -4 | -20 |
| SEA | 10 | 24 | 37 | 17 | 17 | 26 | 82 | 87 | 57 | 33 | 61 |
| SF | 5 | -77 | -83 | -52 | -64 | -74 | -17 | -17 | -72 | -58 | -39 |
| STL | 7 | -54 | -44 | -12 | -9 | -27 | 24 | 19 | 44 | 33 | 26 |
| TB | 6 | 40 | 27 | -32 | -52 | -15 | -4 | -13 | -59 | -59 | -35 |
| TEN | 3 | -36 | -35 | -50 | -44 | -39 | 35 | 35 | 3 | 3 | 18 |
| WSH | 9 | 78 | 78 | 21 | 21 | 50 | -17 | -9 | -116 | -111 | -61 |
From a coaching perspective, this information helps guide film study and scheme preparation in the off-season and during the season. Opponent and self-scout should be illuminated through the analytics of situational performance. Now the analysis continues to the more granular play-by-play level, again using a success metric to unearth scheme and personnel tendencies. From the macro to the micro, analytics and data visualization can be leveraged to aide in productivity and increase efficiencies.
From an executive perspective, a macro level drive analysis links to draft and free agency needs. This analysis is calibrated to accurately reflect performance without the clouding of emotion. Analytics has a place in the spectrum of football organizational decisions. Sometimes it will validate gut instincts and other times go against it. It is a piece – not the most important piece – but an extremely useful piece when properly integrating in the decision making processes that occur daily in a professional football organization.
A few odd and ends are also included in the following table. Enjoy.
| Team | wins | 3 and Punt (Q-Scores): | OFF | DEF | TEAM | O # | D # | 0-play TDs | Opponent 0-play TDs |
|---|---|---|---|---|---|---|---|---|---|
| ARI | 13 | -178 | 201 | 44 | 26 | 37 | 7 | 1 | |
| ATL | 8 | -189 | 187 | 11 | 28 | 32 | 3 | 2 | |
| BAL | 5 | -185 | 207 | 16 | 38 | 40 | 4 | 5 | |
| BUF | 8 | -201 | 186 | -24 | 50 | 42 | 3 | 2 | |
| CAR | 15 | -189 | 189 | 7 | 38 | 41 | 4 | 3 | |
| CHI | 6 | -182 | 201 | 12 | 41 | 42 | 0 | 7 | |
| CIN | 12 | -187 | 184 | 15 | 36 | 43 | 1 | 3 | |
| CLE | 3 | -203 | 210 | -13 | 40 | 34 | 3 | 4 | |
| DAL | 4 | -183 | 183 | -5 | 39 | 37 | 2 | 6 | |
| DEN | 12 | -193 | 194 | -3 | 53 | 51 | 6 | 3 | |
| DET | 7 | -202 | 177 | -24 | 43 | 38 | 2 | 1 | |
| GB | 10 | -193 | 178 | -12 | 44 | 42 | 2 | 2 | |
| HOU | 9 | -205 | 200 | 2 | 51 | 53 | 3 | 3 | |
| IND | 8 | -187 | 188 | -17 | 48 | 40 | 5 | 4 | |
| JAX | 5 | -193 | 196 | -23 | 49 | 38 | 4 | 7 | |
| KC | 11 | -201 | 206 | -3 | 40 | 38 | 6 | 2 | |
| MIA | 6 | -206 | 193 | -14 | 44 | 41 | 4 | 2 | |
| MIN | 11 | -201 | 193 | 33 | 26 | 38 | 5 | 0 | |
| NE | 12 | -187 | 200 | 49 | 37 | 58 | 2 | 4 | |
| NO | 7 | -198 | 196 | 8 | 33 | 36 | 3 | 2 | |
| NYG | 6 | -190 | 199 | -3 | 38 | 35 | 6 | 4 | |
| NYJ | 10 | -187 | 194 | 13 | 51 | 56 | 0 | 5 | |
| OAK | 7 | -204 | 198 | -21 | 48 | 40 | 1 | 4 | |
| PHI | 7 | -202 | 209 | 3 | 47 | 47 | 7 | 4 | |
| PIT | 10 | -210 | 193 | 9 | 31 | 37 | 3 | 0 | |
| SD | 4 | -192 | 199 | 25 | 33 | 41 | 1 | 5 | |
| SEA | 10 | -189 | 182 | 28 | 32 | 45 | 5 | 3 | |
| SF | 5 | -206 | 204 | -34 | 44 | 32 | 1 | 2 | |
| STL | 7 | -198 | 195 | -23 | 51 | 41 | 3 | 4 | |
| TB | 6 | -194 | 195 | 13 | 27 | 31 | 3 | 3 | |
| TEN | 3 | -193 | 204 | -13 | 53 | 44 | 2 | 6 | |
| WSH | 9 | -204 | 202 | -30 | 44 | 33 | 5 | 3 |

Dr. Guyader is the Owner / Founder of The Q5.com, which specializes in Football Visualizations and Drive Analytics. Additionally, Guyader has 10 years of Division I football experience coaching top-tier and historic programs. From guiding third round NFL draft pick Ramses Barden for four seasons at Cal Poly to converting 6-foot 10-inch lineman Ali Villanueva to wide receiver at the United States Military Academy at West Point, Andy knows how to coach on the field and how to game-plan in a meeting.