
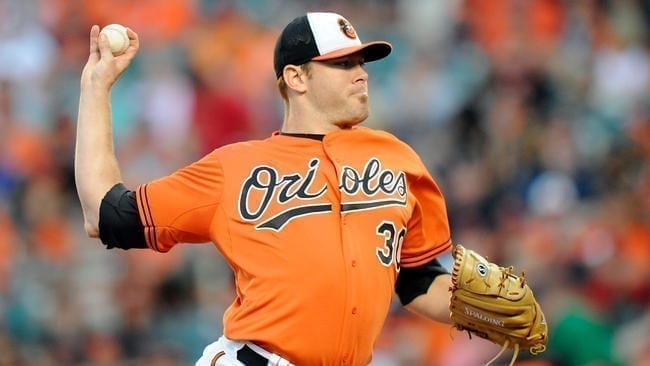
Chris Tillman entered 2015 on the heels of back-to-back 200+ IP seasons with solid sub-4.00 ERAs and looked like a reliable mid-rotation arm, though judging his 4.22 FIP (Fielding Independent Pitching) in those two seasons, he was more of a #4-starter than an emerging #3-starter. But then his already-tenuous skillset dipped in 2015 and made him look like a #5-starter. So what happened with Tillman and can he rebound in 2016?
(You can discuss this on the BSL Board here.)
First off, if you followed his 2014 closely, it was clear that his 3.34 ERA was a bit lucky for the skills he posted with it. The strikeout rate really tumbled from 2013 with the only counterbalance being a drop in home run rate from 1.4 HR/9 to a more palatable 0.9 HR/9. But even with that as a backdrop, his 2015 was a big disappointment. Even the most pessimistic on Tillman didn’t tab him for essentially a 5.00 ERA in 31 starts. The strikeout rate sank further and the walk rate jumped a little, but the BABIP and LOB% rates both fell apart, though.
STRIKEOUT RATE
Given the way the skills have matched the last two years compared to that 2013 season, I’ll be comparing ’13 vs. the combined efforts of ’14 and ’15. In 2013, he fanned 21% of the batters he faced (league average for starters was 19%). In 2014-15, he fanned just 17% while the average held firm at 19%. One of my favorite metrics for judging stuff is Swinging Strike rate which is just the percentage of pitches that were swung through.
In none of the last three seasons has Tillman even been average with his overall rate and it gets even uglier when you viewing it by pitch. Sometimes a pitcher might not have a great overall SwStr%, but if he has that one pitch that really stands out, he can still get a decent number of strikeouts. Tillman doesn’t have that. Look at his pitches compared to average the last three years:
|
Swinging Strike Rate by Pitch |
||
|
Pitch |
2013 Tillman/Avg |
2014-15 Tillman/Avg. |
|
Fastball |
10%/7% |
8%/7% |
|
Changeup |
13%/16% |
12%/16% |
|
Curveball |
6%/11% |
6%/12% |
|
Slider |
7%/16% |
10%/16% |
If you’re not getting swings-and-misses, that means you’re allowing contact and not much good can come from contact. That’s why strikeouts are viewed so favorably. The only way you can even reach base on a strikeout is if the catcher makes a mistake. But allowing contact opens a whole can of worms. Is it a playable ball? Will the defense even make the play if it is? Groundball contact goes for more hits, flyball contact (obviously) goes for more homers. On the extreme end of either, the pitcher is given some credit for being in control and inducing weaker contact (dribblers and pop-outs, respectively).
BABIP
Tillman is stuck in the middle. He has been increasing his GB/FB ratio each of the last three years, but still barely above a 1:1 ratio: 0.78, 0.97, 1.03, and 1.23. In 2013 and 2014, Tillman posted BABIP totals of .269 and .267. It obviously wasn’t due to any extreme inducing of weak contact either on the ground or in the air so it must’ve been one of the other key components of BABIP: defense. Regardless of what kind of contact a pitcher is giving up, the defense can minimize the damage by turning it into outs. An exemplary defense can really help a pitcher (see also: Royals, KC). Turns out the team defense might’ve been a big key for Tillman.
Looking at the FanGraphs defensive runs above average data over the last three years shows the Royals heads and shoulders above the league, but then the Orioles checking at second and they’re also ahead of the next time by a wide margin.
|
DRAA 2013-2015 |
|
|
KC |
219.3 |
|
BAL |
112.5 |
|
BOS |
75.2 |
|
CIN |
65.9 |
|
SF |
65.3 |
However, we need a detailed look at those last three years to see why Tillman might’ve fallen so hard in 2015. Baltimore’s rankings by year: 3rd in 2013, 2nd in 2014, and then 15th last year. Tillman’s BABIP by year: .269, .267, and .293. His 2015 mark is actually a few ticks better than the .297 league average for starters, but with his skills he need to substantially beat the average to post quality results.
PITCH LOCATION
So we saw Tillman strikeouts, become more hittable, and generally struggle all year. In fact, it wasn’t for his July, he might’ve been near the mid-5.00s with his ERA. His ERA by month: 7.58, 5.03, 5.13, 1.31, 5.73, and 6.51. We know the defense got worse behind him which really hurt, but a shift from great to average defense isn’t the sole reason in going from the mid-3.00s to a near-5.00 ERA in one season. What else happened?
Something that I think might be a factor is his pitch location. Specifically, his fastball. And more specifically than that, the high fastball.
Let’s look at his percentage of fastballs in the upper third of the zone of the last three years: 44%, 44%, and 38%. And the majority of that loss in the upper third went directly into the middle third of the zone – aka the hitter’s sweet spot. Now let’s look at his batting average and BABIP off fastballs in the upper third: .240/.274, .230/.256, and .270/.314. As the fastball comes down in the zone, it’s going for more hits.
Let’s isolate the performance of the fastball in the upper third and break it down as 2013-14 together and then 2015 by itself since last year saw the substantial BABIP jump.
2013-14: .196/.283/.324 with a .232 BABIP in 434 plate appearances on fastballs in the upper third
2015: .245/.350/.387 w/a .314 BABIP in 182 PA.
Not only were there were fewer fastballs in that zone, but they were also hit harder. Parsing the data one step further, let’s look at his groundball performance on fastballs in the upper third with one key element added in: pull percentage.
2013-14: .174/.174/.203, 32% Pull
2015: .421/.421/.526, 16% Pull
Pulled groundballs are generally weaker and easier to turn into outs. I didn’t include BABIPs there because it’s obviously the same as the batting average since we’re only looking at pulled groundballs off of fastballs in the upper third – admittedly a very parsed sample, but still instructive nonetheless.
WHAT NOW?
Can Tillman reverse the trend and recapture his 2013-14 form? I’ll answer that with a resounding “maybe”. Followed by a firm “but probably not”. Tillman just doesn’t have enough swing-and-miss stuff, leaving him at the mercy of his defense and plain ol’ luck.
Part of the issue in 2015 might’ve simply been the fact that shortstop J.J. Hardy only logged 995 innings at short. That was easily the lowest of his five seasons with the club, but at age-33, it’s unlikely to shoot back up to the 1371 he averaged over the last three seasons. He wasn’t even expected to be this durable in the first place as he averaged just 112 games per season in his first six years before joining Baltimore.
Manny Machado is still a total stud at third base, essentially a second shortstop, but he can’t do it alone. In addition to Hardy’s falloff in playing time, Jonathan Schoop fell apart at second base going from 7.5 DRAA in 2014 to a pitiful -3.8 last year. So the infield defense has regressed, leaving Tillman to fend for himself with luck. And when you’re allowing as much contact as Tillman is with that lame 16% K rate, the margin for error on luck is small. Again, this is why strikeouts are so important.
There is nothing in his profile as it stands today that should lead us to believe he can spike his strikeout rate. He might add a tick or two up to 18%, but even that is still two percentage points below average these days. What I’ll be looking for early in the regular season is how often he elevates the fastball.
Up there, he can get the benefits of effective velocity and turn his 91-93 MPH heater into something that is seen more as a mid-90s offering to the opposition. Since generating swings-and-misses isn’t a key component to his game, he needs to induce weaker contact and that high fastball was a key to doing so when he was successful in 2013-14. I was one of those who believed Tillman could bring his FIP closer to his ERA as he went into his mid-20s, but I no longer feel that way with this particular skillset. I think a low-4.00s ERA should be the upside projection right now.

Paul Sporer is currently a contributor to FanGraphs / RotoGraphs. He has worked for/still works for Rotowire, Baseball Prospectus, Rotogrinders, The Fantasy Fix, Draft Day, and PaintTheBlack.com – his own website centered around pitching. Additionally, he’s written for several Baseball Prospectus Annuals, contributed to Rotowire’s 2015 magazine, and spoken at a couple of BaseballHQ First Pitch Arizona events. His popular starting pitching guide is available at paulsporer.com.