
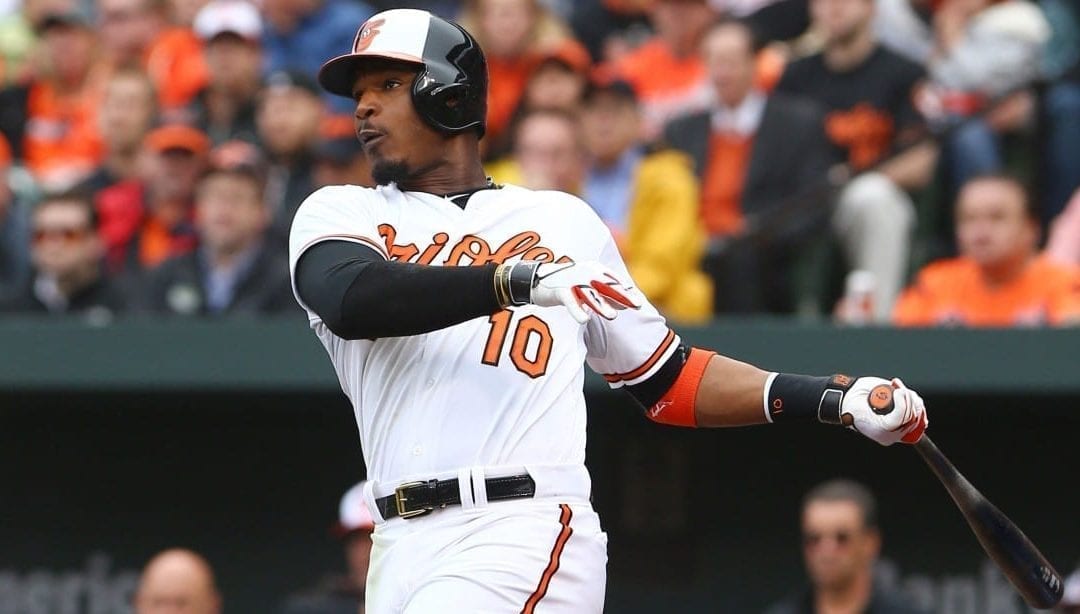
The signing of Pedro Alvarez has brought on much derision for the Orioles as they are now loaded with premium strikeout batters in the heart of the order (to say nothing of the fact that they’re also premium power bats, but we know that) in the form of Chris Davis, Mark Trumbo, and Alvarez. Matt Wieters could be a part of the crew, too, if his 24% mark from 2015 sticks around. Brandon mentioned that those three could put up 100 HR and 500 Ks next year. And, of course, he’s right. Add in Jonathan Schoop toward the bottom of the lineup and it’s clear this team will be a contender for most strikeouts in the league.
(You can discuss this on the BSL Board here.)
Alvarez brings with him a 29% career strikeout rate and that 9% walk rate we discussed earlier. His 25% and 27% rates the last two years are actually a sharp improvement on the 31% rate he held for the first four years of his career. And yet despite all the swing-and-miss and only a decent walk rate to kinda balance it out, he’s still been a plus bat every year but once – a disastrous 2011 in which he played just 74 games. By the way, that 74-game sample is a good look at how this kind of profile can go cold for huge stretches. Hell, even his 2015 which was 14% above average by weighted runs created (wRC+) had a 40-game run of .592 OPS in the early summer.
But are strikeouts really the problem for this team?
They could be as Dave Cameron notes in a piece at FanGraphs, but they aren’t the real problem with this team. The problem is that they don’t offset the swing-and-miss tendencies with enough walks. Alvarez himself comes with a 9-10% walk rate in most seasons with a low of 8% and high of 10%. Of the nine hitters to log at least 300 plate appearances for the O’s last year, only Davis was north of 10% at 13% while Manny Machado’s 9.8% rounds up to 10%.
Meanwhile, four of the nine players with those 300+ PA had a walk rate of 5% or lower. Of the 268 batters who had 300+ PA in the majors last year, only 52 carried a 5% or worse walk rate. Or 19%. Four of them were on the Orioles and account for 44% of their players with 300+ PA (the 300+ PA threshold is what we’re using the rest of the way, too, so keep that in mind when I cite stats). Houston was the only other team that had four, but one of theirs was Jose Altuve so it was hardly a negative. All four of the Orioles players – I guess I should name ‘em at some point: Adam Jones, J.J. Hardy, Jimmy Paredes, and Schoop – all had a .310 or lower on-base percentage.
On the other hand, there were 48 batters with a 25% or higher strikeout rate last year. The Orioles also had four of those guys. Unfortunately there is some crossover with the 5% or lower walk rate group as Paredes and Schoop are joined by Davis and Ryan Flaherty. Guess how many of those 48 batters had a walk of 8% (league average) or higher? Yes, it was 29, I heard you say it, you in the back of the room. Good guess. Only Davis qualified among the Oriole quartet. Those 29 guys had about a .327 OBP on average. For the 19 who were at 7% or lower, they amassed just a .292 OBP on average.
Strikeouts do matter because at least anecdotally it seems like high-strikeout teams are prone to slumps and those slumps tend to be amplified in October when facing the best pitchers at max effort. But LOL on Baltimore worrying about October right now. I’m not saying it won’t happen, I’m saying October performance shouldn’t be a major concern right now considering the path to getting there remains a laborious one that has just begun. Speaking of October, in a four-game sweep at the hands of the New York Mets, the Cubs fanned 27% of the time – even more than their league-leading 25% mark from the regular season.
There is a glimmer of hope for the team’s OBP in the form of Hyun-Soo Kim. In 4768 plate appearances over in Korea, he walked more than he struck out and posted a 13% walk rate. The strikeout rate was just 11%. That’s almost the inverse of Machado’s rates which were pretty good at 10% BB and 16% K. One guy alone won’t fix things, but he can definitely move the needle if he’s able to emulate his Korean Baseball Organization marks or deliver a reasonable facsimile thereof. I have to stress it’s only a glimmer of hope, though.
The ZiPS projection system at FanGraphs projects just Davis and Alvarez for a 10% walk rate. Machado and Reimold each get a 9% and then Kim and Rule 5 newcomer Joey Rickard each check in at 8%. Only Machado, Davis, and Kim are projected to have better than .330 OBP. A total of 118 players were projected at .330 or better – or about four per team, so the O’s are one shy of the average which doesn’t feel big because “one” never feels big, but another 500-something plate appearances of a .330 or better OBP would really help this lineup.
Now because ZiPS doesn’t try to guess playing time there are tons of players projected for awful numbers in substantial samples of playing time that they’d never get if that’s how they were playing so just counting the sub-.300 OBPs or low-.300s ones isn’t terribly instructive. There are 702 guys projected to be .300 or lower and the O’s have 24 of them which is their reasonable share if you’re dispersing the 702 among the 30 teams. But the problem for the O’s is that many of those 24 are expected to be key contributors or prominent backups in the case of injury: Hardy (.283), Paredes (.284), Caleb Joseph (.286), Flaherty (.289), Henry Urrutia (.293), Dariel Alvarez (.294), Christian Walker (.295), Schoop (.295), and Reimold (.300). Plus five others on the wrong side of .315.
For those curious, league average OBP last year .317 so all of these guys are projected to be below the global average let alone the fact that most would also be well below the average for their position. Here is the average OBP by position last year:
- Catcher .302
- First Baseman .336
- Second Baseman .315
- Shortstop .307
- Third Base .318
- Leftfield .319
- Centerfield .326
- Rightfield .326
Strikeouts aren’t great, but plenty of times they are no worse than any other out and in some situations they are even better (those are admittedly quite rare). They are not why this team is starting to get inked into the five-spot of AL East predictions. In the last three seasons, there have been 26 teams to post a .310 OBP or lower (including the 2015 Orioles). Those teams averaged 3.8 runs per game with the aforementioned ’15 Orioles topping the list at 4.4 runs per game.
They were one of just two teams in the (admittedly small) sample to top the 4.2 runs per game league average from that three-year span (Minnesota 2015 was the other). The 2015 team’s .421 SLG was easily the best of those 26 teams and obviously helped offset the lack of on-base ability. But they were an outlier within this group. It seems the best the Orioles can hope for on offense with this construction is a repeat of last year and that yielded all of a .500 record. Barring a team-wide change in approach, the lack of runners on-base is going mitigate the impact of the power and result in a lot of solo homers.
The worst part of it all is that it further reminds us of how just perfectly Dexter Fowler and his career .363 OBP (even last year’s career-low .346) would have fit atop the lineup.

Paul Sporer is currently a contributor to FanGraphs / RotoGraphs. He has worked for/still works for Rotowire, Baseball Prospectus, Rotogrinders, The Fantasy Fix, Draft Day, and PaintTheBlack.com – his own website centered around pitching. Additionally, he’s written for several Baseball Prospectus Annuals, contributed to Rotowire’s 2015 magazine, and spoken at a couple of BaseballHQ First Pitch Arizona events. His popular starting pitching guide is available at paulsporer.com.